New Capital is part of EFG Asset Management. For more information visit: www.efg.com
Investment Insights
US CPI inflation eases in July
At long last, headline CPI inflation declined in the US from 9.1% in June to 8.5% in July (y/y). Core inflation remained unchanged at 5.9%. In analysing the US CPI data, Stefan Gerlach notes that it is useful to look at the disaggregated data in terms of both monthly and annual changes.
The headline CPI consists of six components:
- Food, which can be divided into food at home (weight 8%) and food away from home (5%).
- Energy, which can be divided into energy commodities (6%) and energy services (4%).
- Core inflation, which can be divided into commodities less food and energy commodities (21%) and services less energy services (56%). (The latter is dominated by shelter, with a weight of 32%.)
The graph below shows that the prices of energy commodities – essentially fuel – fell sharply in July but nevertheless rose almost 50% over 12 months. Given their weight in the CPI, this had exerted strong downward pressure on overall inflation. The prices of energy services – electricity and gas – were broadly stable month-on-month but have risen by almost 20% over the past year. Overall, energy prices have been a key driver of inflation over the past year, rising by more than 30%.
Prices for both food at home and food away from home rose by about 1% month-on-month and by around 10% year-on-year. Food prices have thus also played a role in pushing up inflation over the last year.
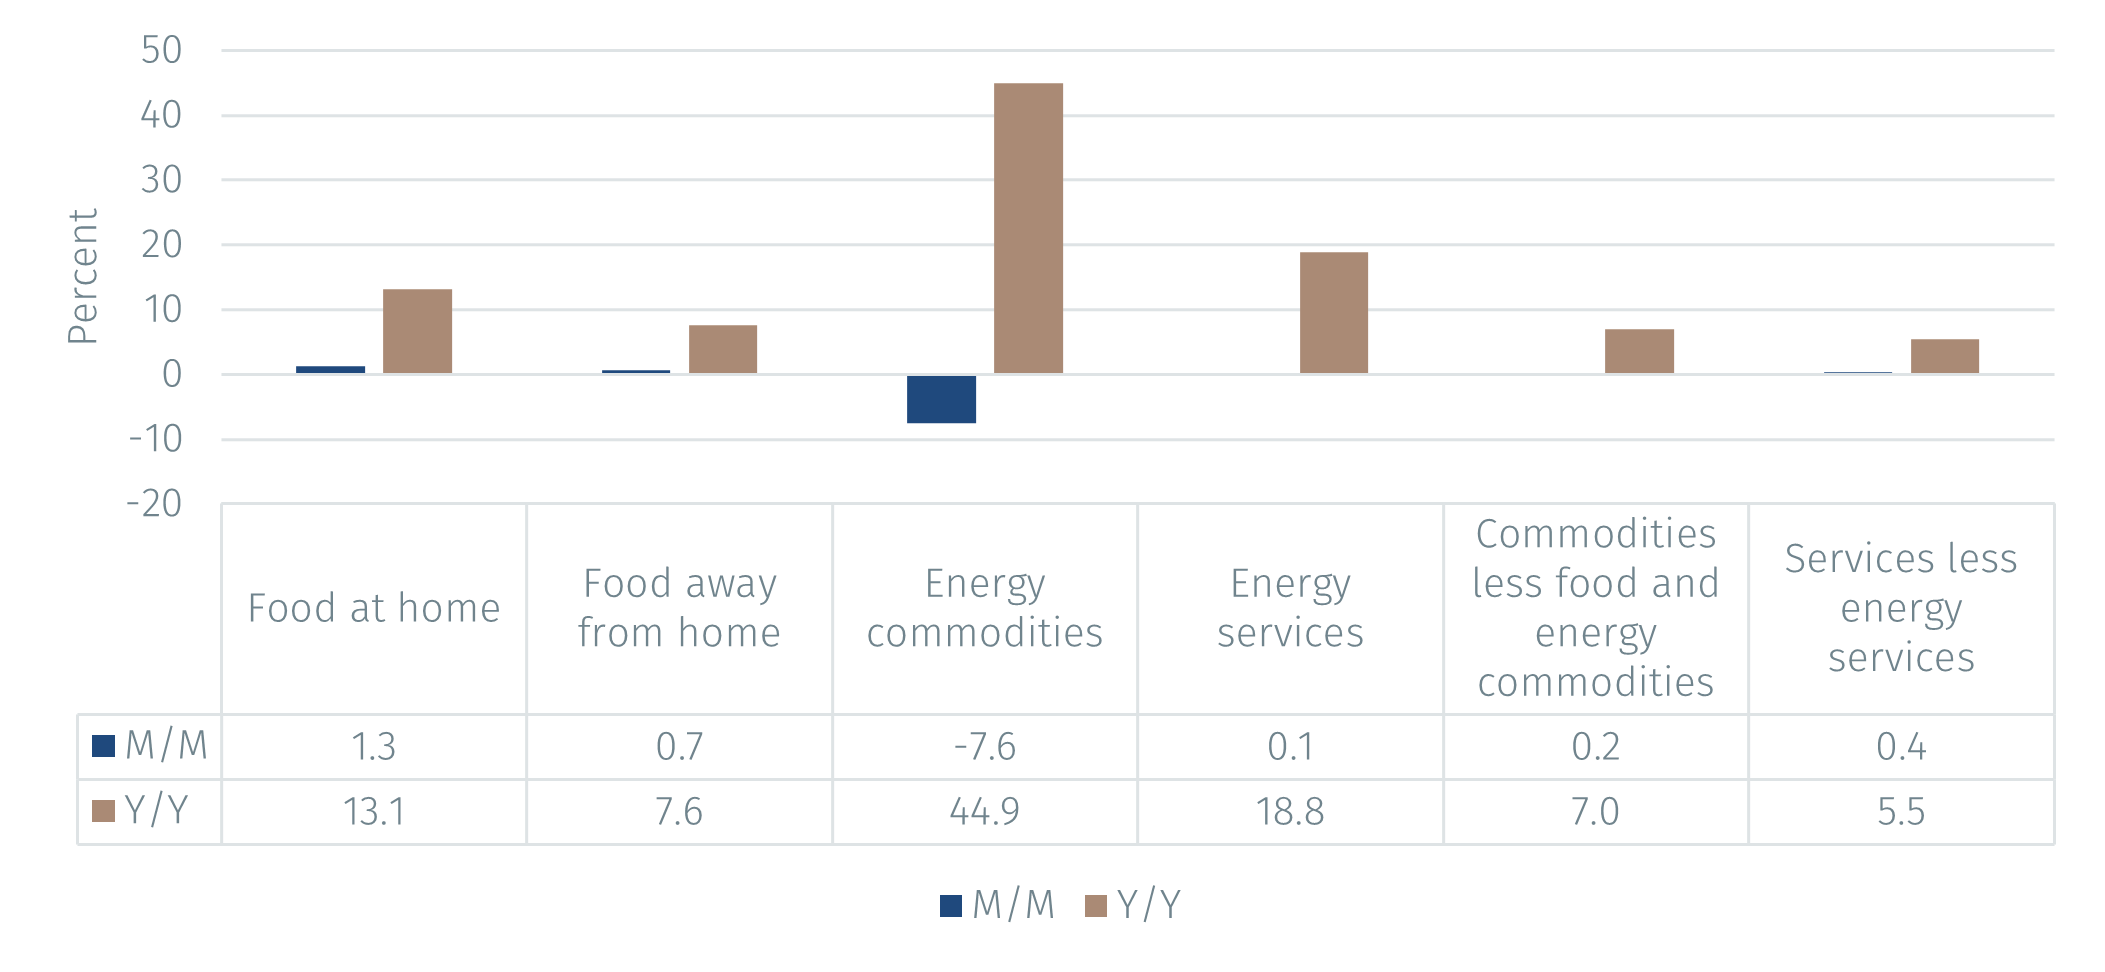
Source: BLS and EFGAM calculations. Data as of 12 August 2022.
Turning to the components of core inflation, the graph shows that both rose by about 0.3% month-on-month and around 6% year-on-year. While these rates of price increase are lower than those for energy and food, these components constitute three quarters of the CPI basket and are therefore much more important for the evolution of the overall CPI. The fact that they are so much above 2% explains why inflation is far from that target level. Prices for shelter, which is hugely important, rose 0.5% month-on-month and 5.7% year-on-year.
To get a better understanding of US inflation dynamics, it is useful to plot the evolution over time of food and energy prices, and the two components of core inflation. The graphs below show the rate of price change year-on-year and cover the period January 2020 to July 2022. Consider first the food and energy components that are part of headline inflation but not core inflation (note the difference in scale).
The rate of increase in energy prices fell sharply as Covid struck but rebounded a year later, largely because of base effects. They subsequently rose further as the global economy and energy demand recovered. Since May 2021 energy prices have been rising at an annual rate of about 30%. While their weight is small, this is a large cost-push shock to the economy.
The rate of change of food prices started to rise in a sustained way from an annual rate of around 3% in July 2021 to about 12% a year later. That is an unusual development that reflects broader global shift towards much higher food prices. It has been driven by a range of factors (some arising from the Russian invasion of Ukraine), including surging input costs, especially for fertiliser and diesel fuel used in for transportation and farm equipment, droughts affecting crop-producing countries and supply chain issues.
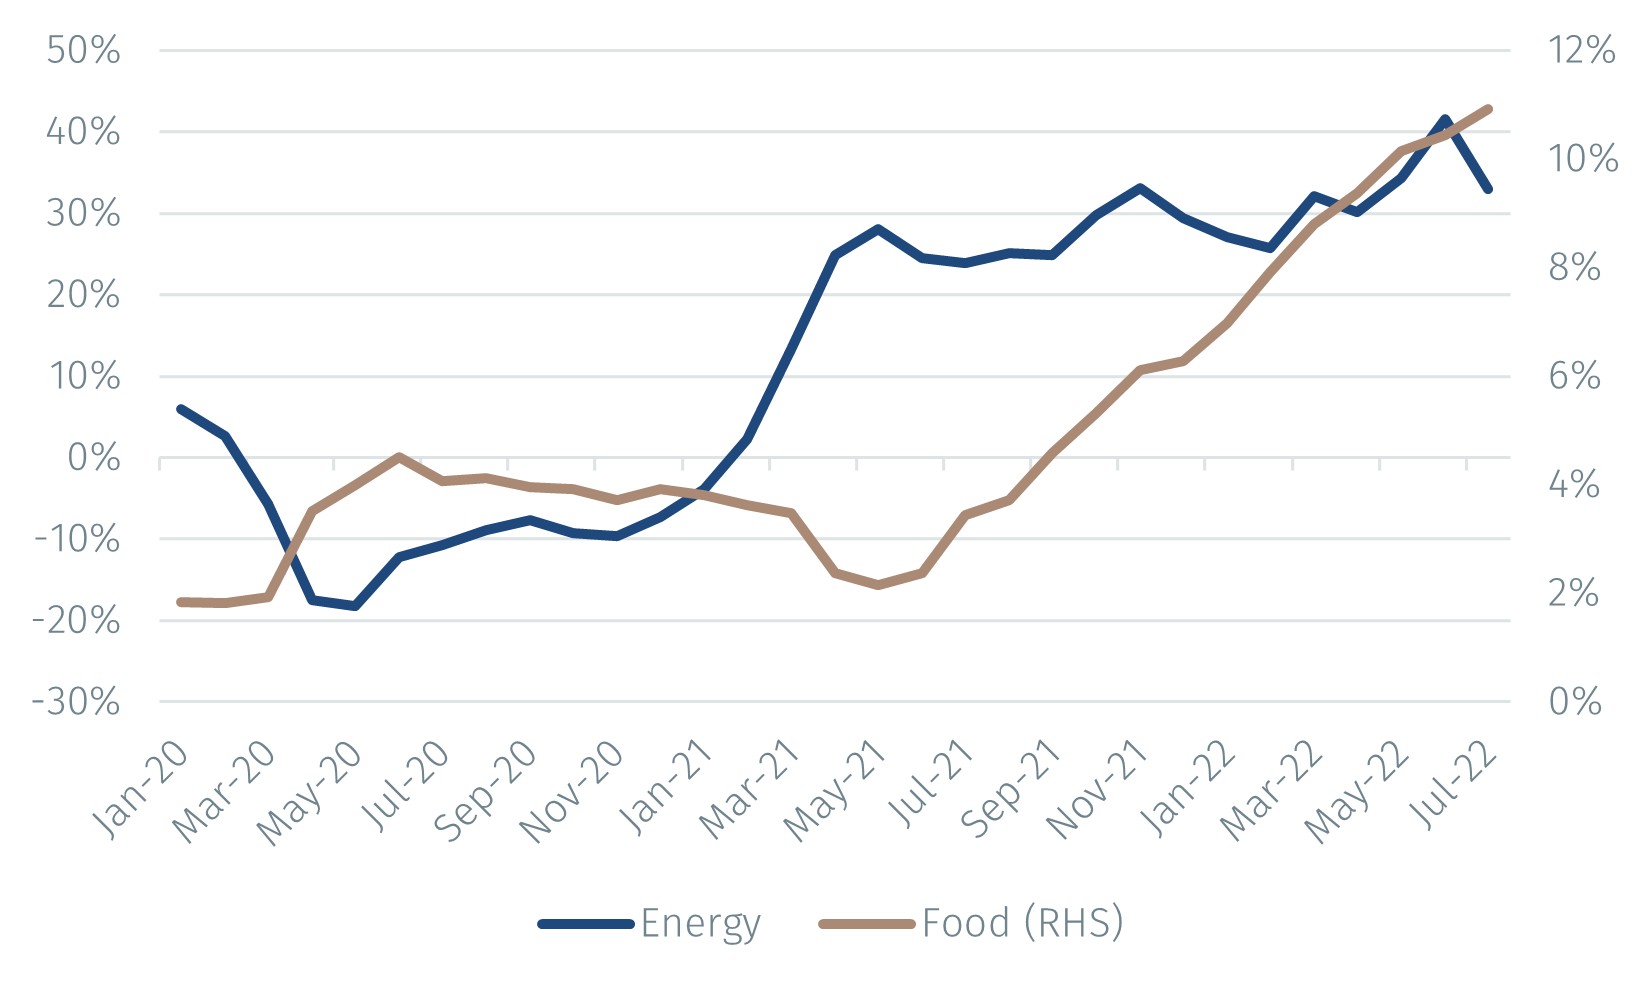
Source: BLS and EFGAM calculations. Data as of 12 August 2022.
It is interesting to note that the components of core inflation have evolved in different ways. The prices of commodities less food and energy fell as the Covid pandemic started, rose sharply a year later, peaked during the summer of 2021, but then started to rise again, and peaked again in March 2022. The rate of price increase has since fallen but, at 6.9% in July, remains much too high.
As emphasized above, the behaviour of prices for services less energy services is critical for the headline inflation because of the large weight of this component in the overall CPI. The graph shows that these have been rising at an increasing rate from 1.6% in March 2021 to 5.6% in July.
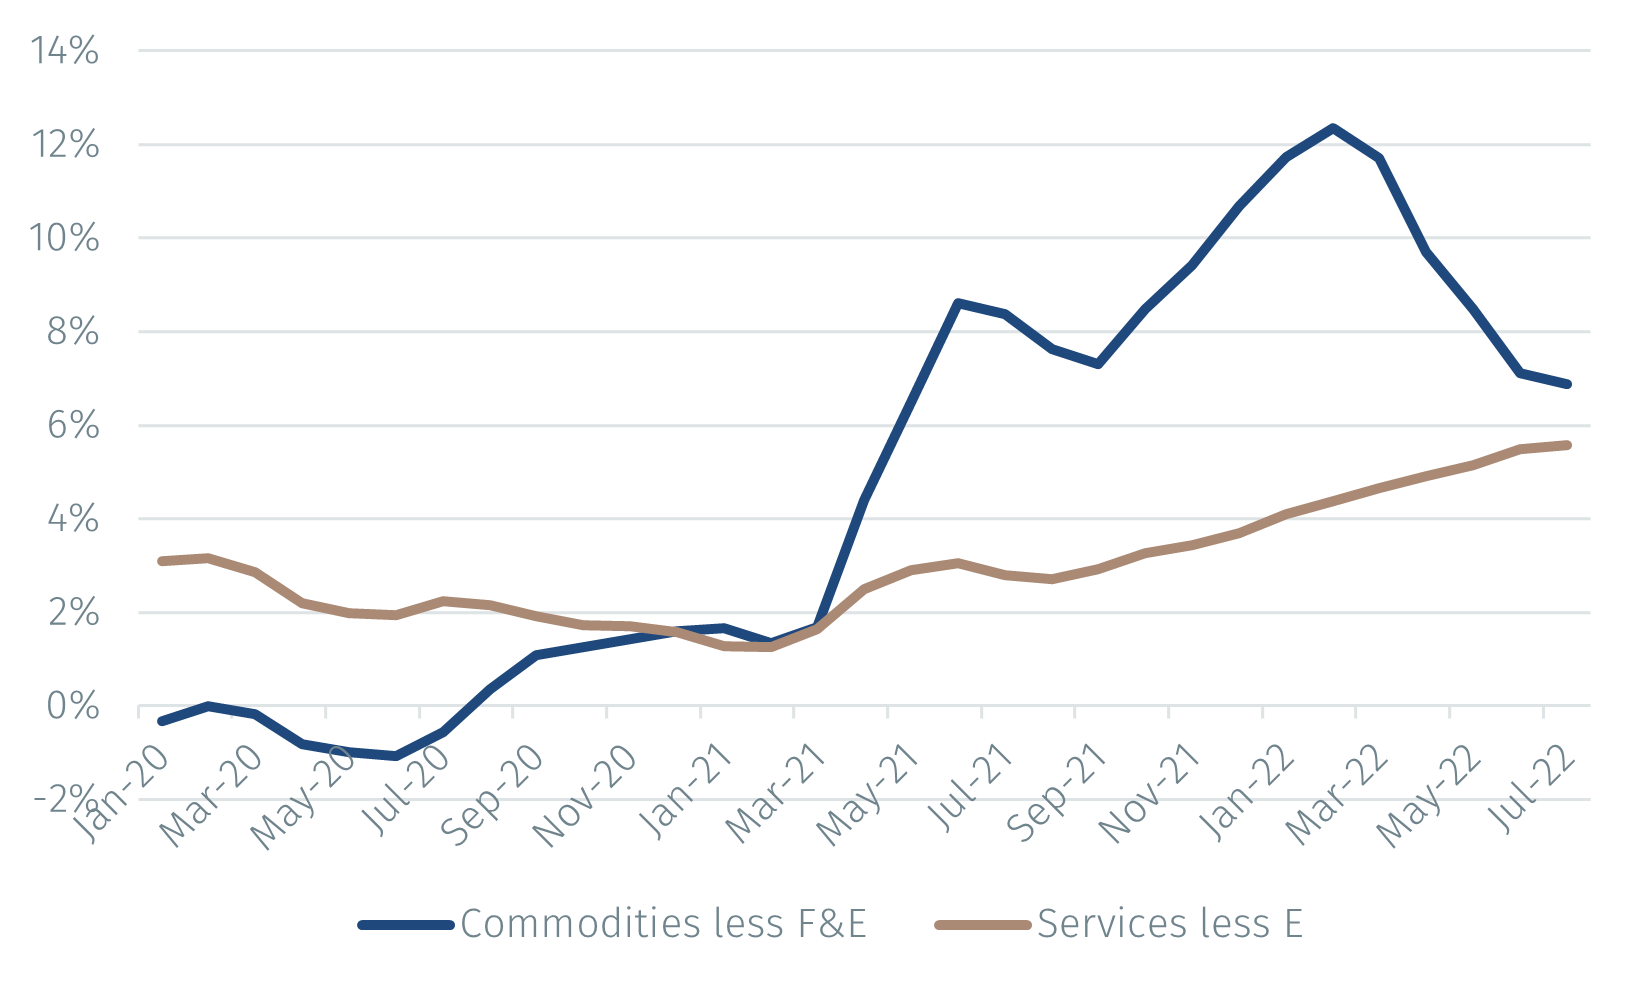
Source: BLS and EFGAM calculations. Data as of 12 August 2022.
Overall, while US CPI inflation fell year-on-year between June and July, it remains much too high at 8.5%. Although the growth rate of prices for energy and commodities less food and energy are declining, they remain at too high levels. What is more worrisome is that the growth rate of prices for food and services less energy which together account for about 70% of the CPI basket, are continuing to rise steadily.
It appears likely that the Fed will disregard the decline in headline inflation from June to July. With inflation at levels not seen for decades, the Fed is seen as having been too slow to recognise the risk that inflation would surge. It is therefore now focusing on curbing inflation, even at the risk of triggering a slowdown in growth or even a recession.
The Fed is therefore unlikely to scale back its plans to tighten monetary conditions unless it sees clear evidence that inflation is receding. That probably means that it will want to see three months or so of declining inflation, in particular core inflation since fluctuations in energy prices mask the underlying inflation trend.
Important Information
The value of investments and the income derived from them can fall as well as rise, and past performance is no indicator of future performance. Investment products may be subject to investment risks involving, but not limited to, possible loss of all or part of the principal invested.
This document does not constitute and shall not be construed as a prospectus, advertisement, public offering or placement of, nor a recommendation to buy, sell, hold or solicit, any investment, security, other financial instrument or other product or service. It is not intended to be a final representation of the terms and conditions of any investment, security, other financial instrument or other product or service. This document is for general information only and is not intended as investment advice or any other specific recommendation as to any particular course of action or inaction. The information in this document does not take into account the specific investment objectives, financial situation or particular needs of the recipient. You should seek your own professional advice suitable to your particular circumstances prior to making any investment or if you are in doubt as to the information in this document.
Although information in this document has been obtained from sources believed to be reliable, no member of the EFG group represents or warrants its accuracy, and such information may be incomplete or condensed. Any opinions in this document are subject to change without notice. This document may contain personal opinions which do not necessarily reflect the position of any member of the EFG group. To the fullest extent permissible by law, no member of the EFG group shall be responsible for the consequences of any errors or omissions herein, or reliance upon any opinion or statement contained herein, and each member of the EFG group expressly disclaims any liability, including (without limitation) liability for incidental or consequential damages, arising from the same or resulting from any action or inaction on the part of the recipient in reliance on this document.
The availability of this document in any jurisdiction or country may be contrary to local law or regulation and persons who come into possession of this document should inform themselves of and observe any restrictions. This document may not be reproduced, disclosed or distributed (in whole or in part) to any other person without prior written permission from an authorised member of the EFG group.
This document has been produced by EFG Asset Management (UK) Limited for use by the EFG group and the worldwide subsidiaries and affiliates within the EFG group. EFG Asset Management (UK) Limited is authorised and regulated by the UK Financial Conduct Authority, registered no. 7389746. Registered address: EFG Asset Management (UK) Limited, Park House, 116 Park Street, London W1K 6AP, United Kingdom, telephone +44 (0)20 7491 9111.
What type of investor are you?
to view the content you have selected, please choose your country/region and then investor type from the menu:
![]()
You’re about to leave EFGAM website and enter into a 3rd party website
Third party website disclaimer
You are about to enter a third party website, which is owned and operated by an independent party over which EFGAM has no control ("3rd Party Website"). Any link you make to or from the 3rd Party Website will be at your own risk. Any use of the 3rd Party Website will be subject to and any information you provide will be governed by the terms of the 3rd Party Website, including those relating to confidentiality, data privacy and security.
EFGAM does not endorse or approve and makes no warranties, representations or undertakings relating to the content of the 3rd Party Website. EFGAM disclaims liability for any loss, damage and any other consequence resulting directly or indirectly from or relating to your access to the 3rd Party Website or any information that you may provide or any transaction conducted on or via the 3rd Party Web site or the failure of any information, goods or services posted or offered at the 3rd Party Website or any error, omission or misrepresentation on the 3rd Party Website or any computer virus arising from or system failure associated with the 3rd Party Website.
By clicking "Proceed", you confirm that you have read and agreed to the terms herein.